Self-Healing DevOps with xMatters and Dynatrace: Full Disk Prevention
Categories
DevOps & SRE
In our last self-healing DevOps article, we discussed how easy it is to automate rollbacks to fix slow microservices before they become mass outages. Now, we’ll tackle how to take immediate action on a full disk error to prevent services from going down.
Anatomy of a Full Disk
The full disk error strikes fear in the hearts of DevOps teams. A full disk prevents incoming requests from being processed, bringing services to a screeching halt. However, teams using Dynatrace for application performance monitoring can quickly pick up on the warning signs before it gets to this level of severity.
Dynatrace monitors your disk health to pick up on performance metrics that fall below your team’s Service Level Indicators (SLIs) so you catch issues before they snowball into a full, inoperative disk. Measuring key performance indicators allows you to kick off remediation workflows the moment any degradation is detected. Disk health KPIs include:
- Throughput: The total number of bytes read and written to disk per second
- Disk latency: time from I/O request submission to I/O request completion. The average delay of disk read and write operations in milliseconds. This metric is used to detect host slow disk incidents
- Disk space usage: The amount of disk space that’s been used
- Idle time: Amount of time the disk has been idle
For the second scenario in our self-healing DevOps series with Dynatrace, we’ll look at how early detection helps teams respond to prevent a full-stop full disk.
Scenario #2 | Full Disk Prevention
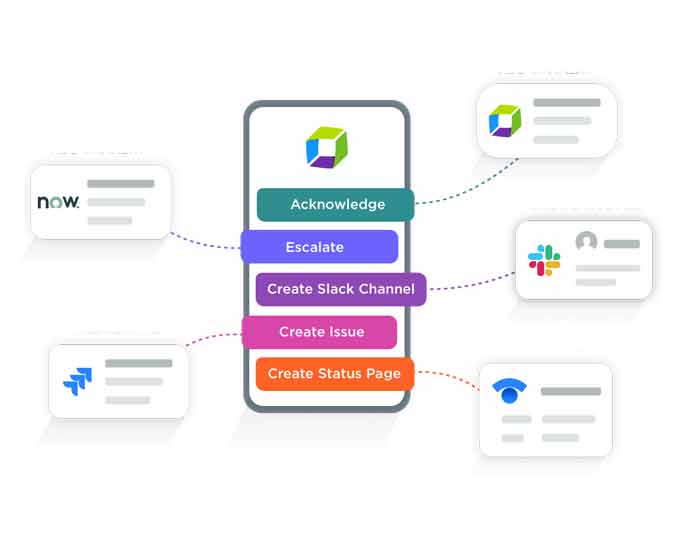
Let’s start by looking at the process flow across systems, built-in xMatters Flow Designer, which makes your Dynatrace data actionable and automates remediation steps at the touch of a button. Not only does this provide responders the ability to immediately take action on alerts, but it helps standardize processes while removing manual work.
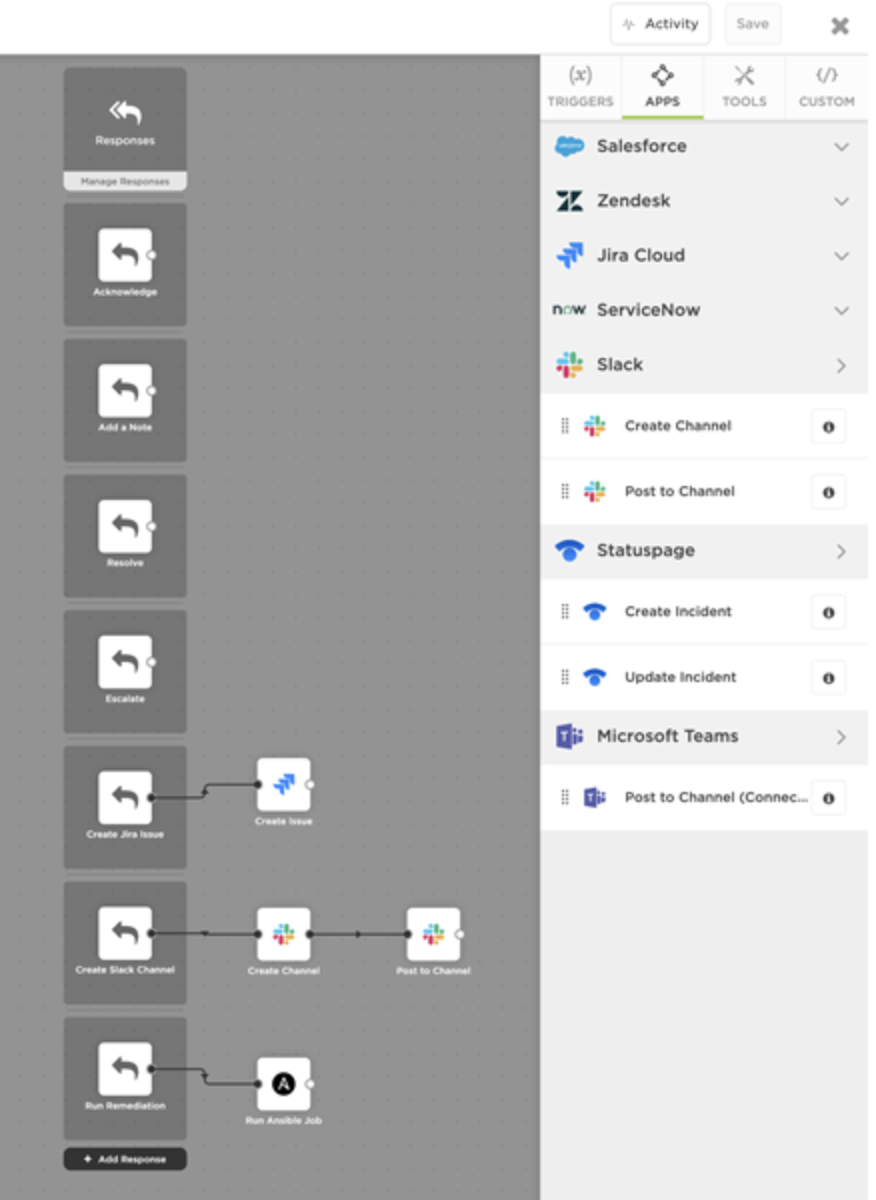
Drag tools onto the Flow Designer palette to automate remediation. Click for a bigger image.
Step 1 | Application Performance Monitoring
Because Dynatrace’s AI-driven monitoring keeps a real-time pulse of your disk health, it surfaces an event when disk latency is first detected. With automated root cause analysis, Dynatrace also correlates related performance errors, such as throughput and IOPS, giving you the full picture of the issue and its impact across service level indicators. When you see the performance issue in time, you can take immediate action before you get a full disk error.
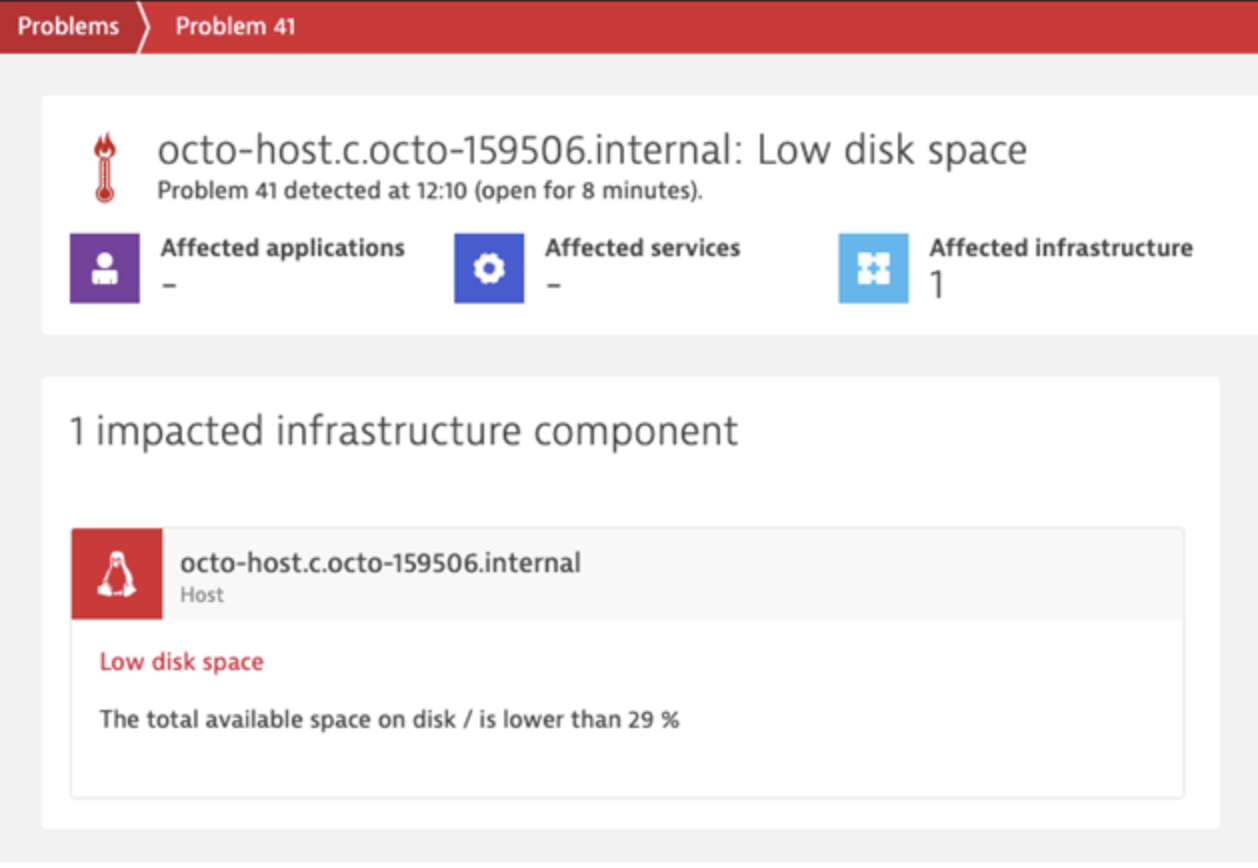
Dynatrace identifies the root cause so you can fix the problem. Click for a bigger image.
Step 2 | Incident Management
Leveraging the workflow you created in Flow Designer, xMatters triggers an alert based on the Dynatrace data. Targeting the proper on-call resources, xMatters gives respondents the incident information from Dynatrace within the alert (no need to click through to additional system dashboards). Based on this contextual data, resources are prompted with their pre-configured response options, each of which kicks off a workflow across systems (based on the severity of the issue). As xMatters decreases time to notify and respond, on-call resources simply select the right response and launch a workflow that restores disk health while simultaneously documenting the issue in their chat and service desk.
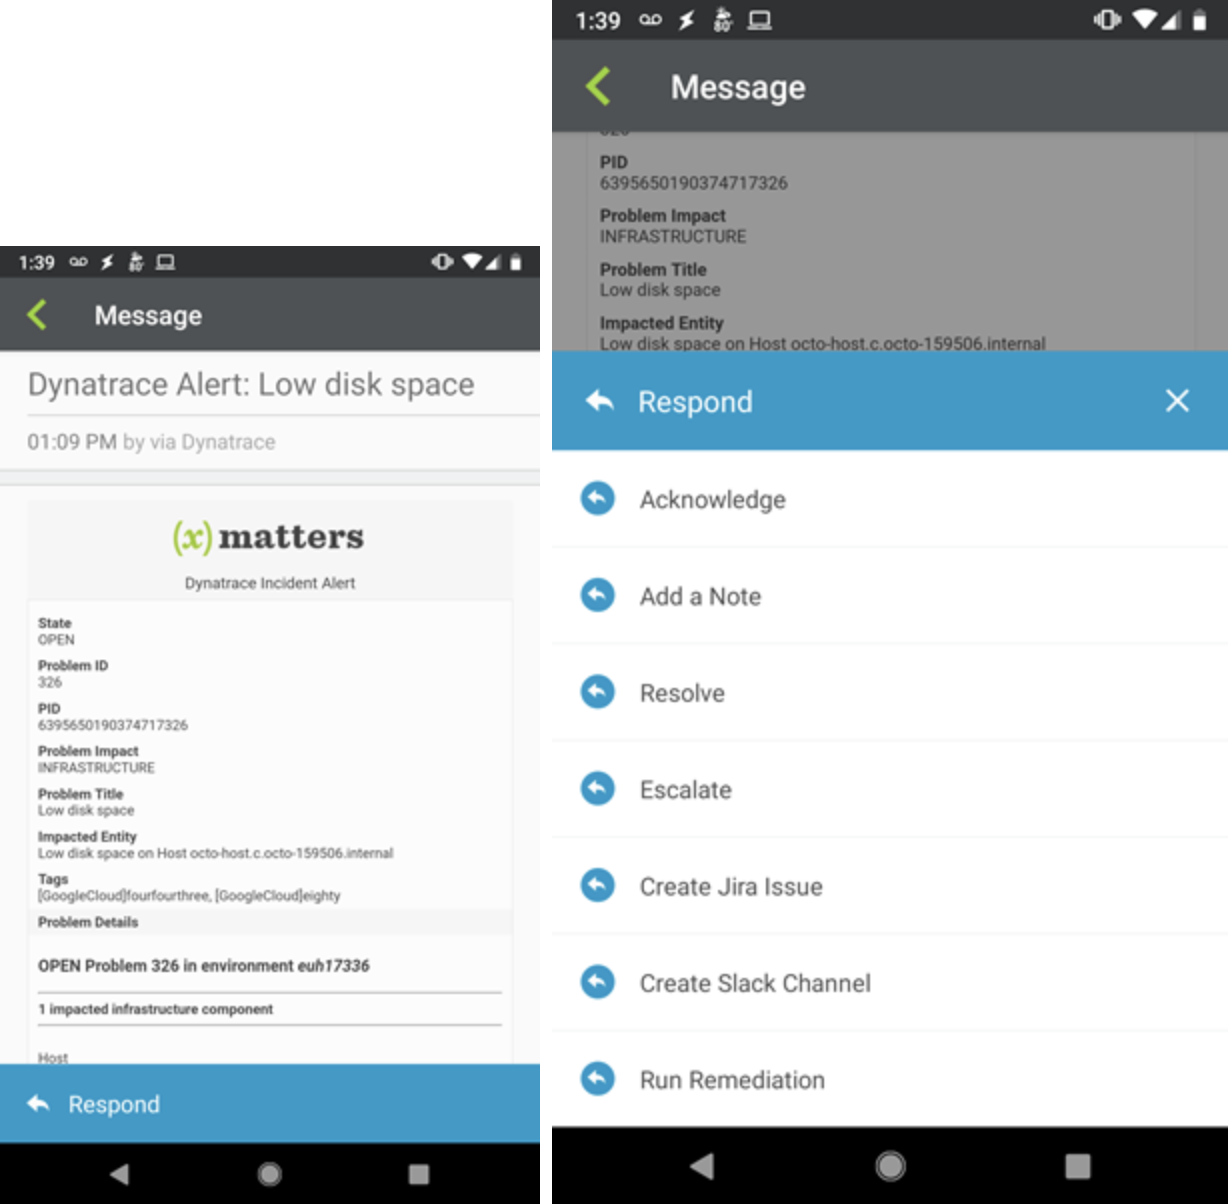
xMatters passes Dynatrace data into alerts (left) with actionable responses (right). Click for a bigger image.
Step 3 | Service Desk
Whether your team uses Jira Service Desk, Zendesk, or ServiceNow (or any combination therein), your workflow in Flow Designer triggers a ticket to be created and automatically updates it with the incident data from Dynatrace. On-call resources select this response and the job runs. In the background, all integrated systems (Dynatrace, Jira Service Desk, and Slack) are updated with details of the action taken and the newly improved performance data.
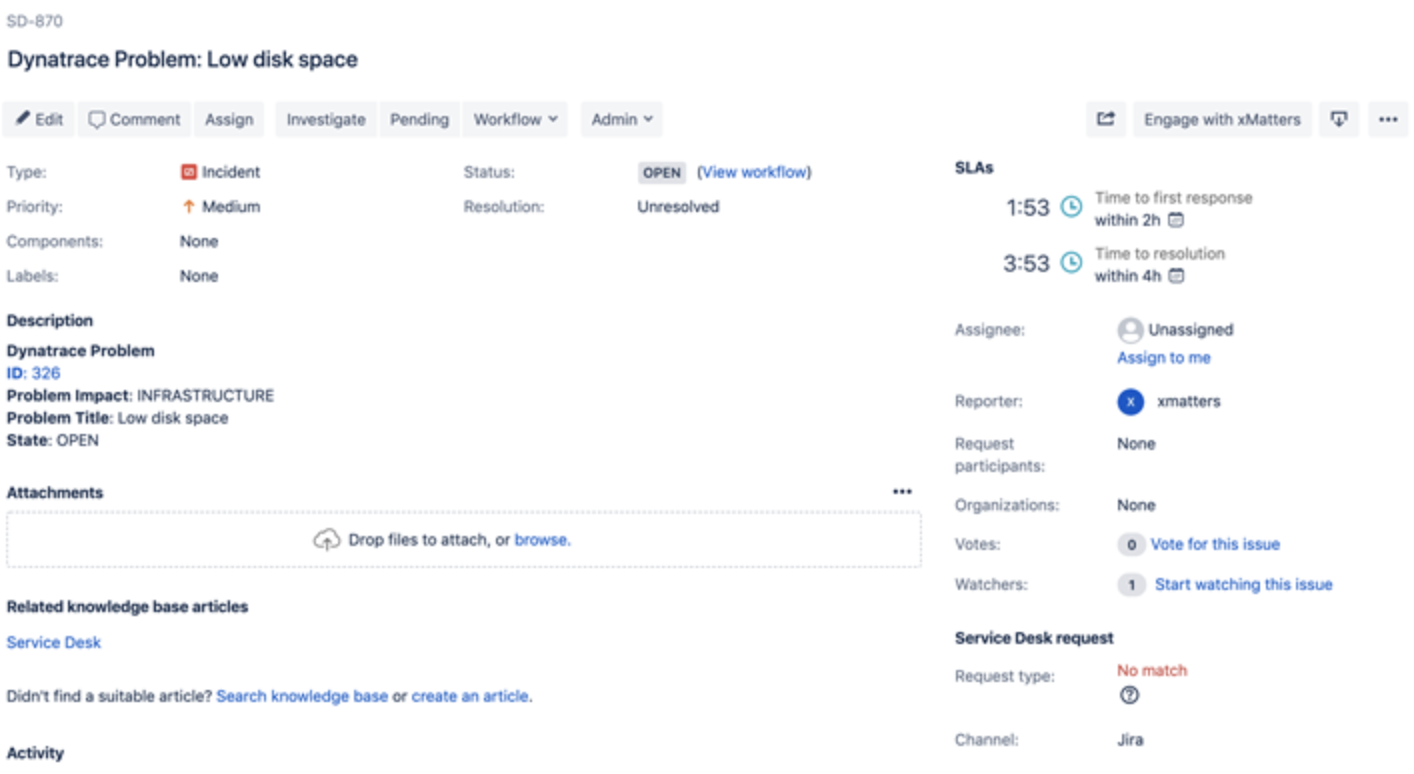
xMatters creates and updates Jira issues with incident information from Dynatrace. Click for a bigger image.
Step 4 | ChatOps
Similarly, your Flow Designer workflow automatically creates a chat channel (our Slack and Microsoft Teams integrations are the most popular). With the use of the respective chatbots, the Dynatrace incident information is incorporated in chats. You can reference on-call schedules and teams to invite the right resources to join the conversation. Once the incident is resolved, your chat transcript will also be automatically attached to the respective service desk ticket to give you and your team a full picture of what occurred for easier post-mortems.
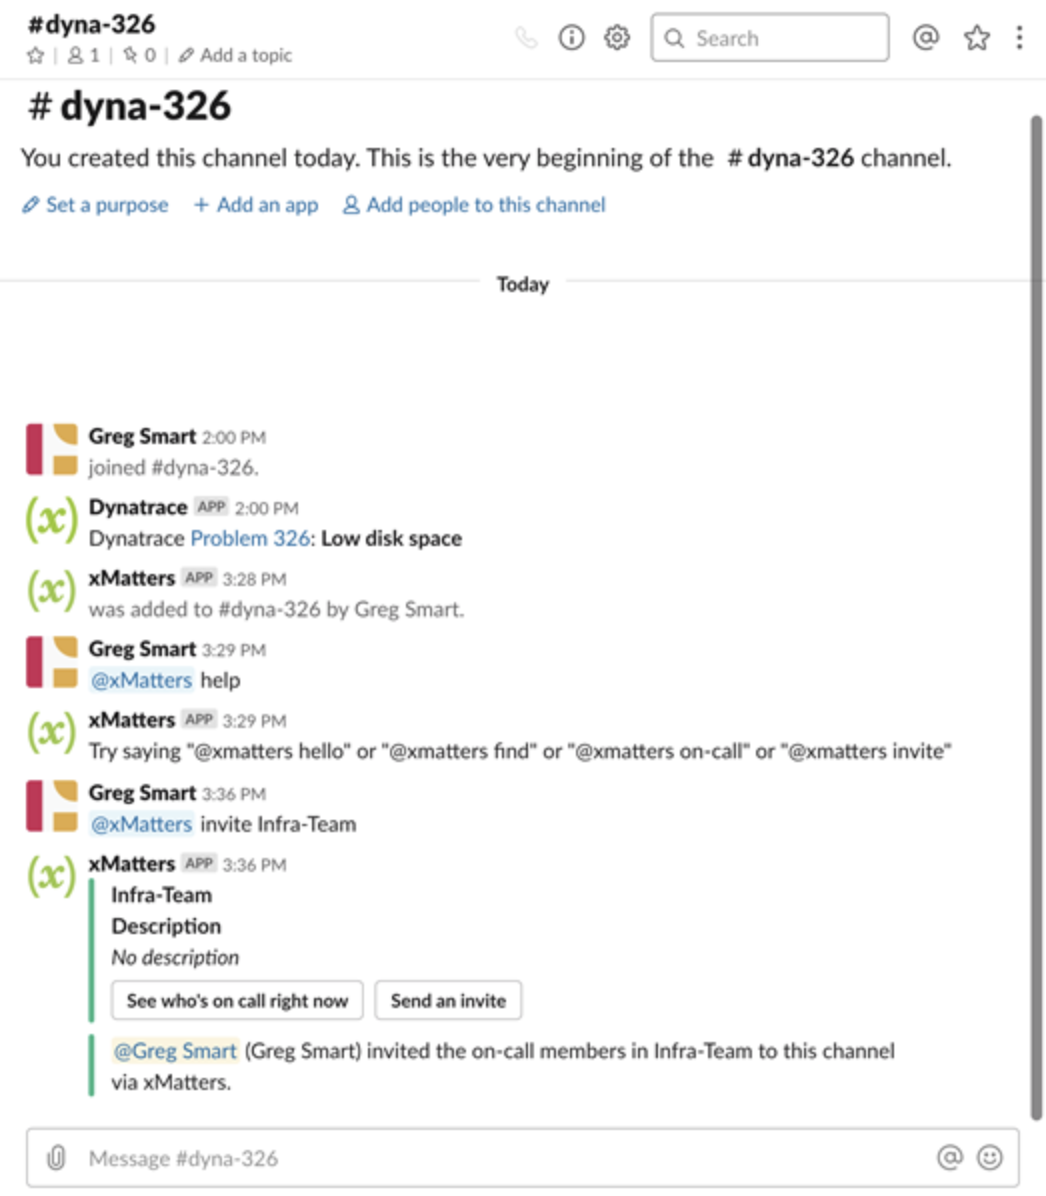
xMatters creates a dedicated Slack channel where users use the Slackbot to find and invite the right team to join. Click for a bigger image.
Step 5 | Configuration Management
As the above steps are being executed, xMatters triggers a runbook in Ansible to push the disk latency fix. In this case, your team determines the deletion of temporary files from the disk to free up processing power will return the disk to its required performance health. The job is run as on-call resources select this response option and, in the background, all integrated systems (Dynatrace, Jira Service Desk, and Slack) are updated with details of the action taken and the newly improved performance data. With a full disk alert successfully averted, resources can now resolve the issue from xMatters, across all your systems.
No more full disk errors
A full disk can be catastrophic for your services (and your end-users). But because we can pinpoint symptoms of an impending full disk before it strikes, you can take proper action and automate workflows across systems to fix it fast.
Imagine what a rock star you’ll be (and how much better you’ll sleep at night) knowing that you have Dynatrace and xMatters as your first line of defense against threats to your disk health lurking around the corner. To learn more, read the recent Dynatrace blog and visit the Dynatrace website for more information.
Ready to kiss full disks goodbye?