Microservices Monitoring and Its Macro Impact

Categories
DevOps & SRE
Microservices are becoming increasingly popular for easily building and deploying scalable applications. In contrast, traditional monolith systems have become too complex to manage and struggles to meet today’s scalability and high-availability requirements.
Containers and serverless architectures can dramatically simplify application workload development, operations, and maintenance. Basing an application on loosely coupled, interconnected services — typically using an HTTP API call — minimizes the impact of failures. When one component fails, the remaining parts of the application are still intact. Plus, it’s easier to manage each microservice as a stand-alone unit. Because of this, interest in microservices has grown over the past five years.
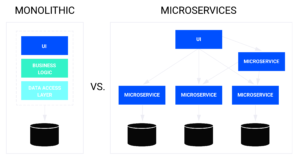
Monolithic vs. Microservices Architecture
Although this move from traditional monolith architecture into microservices has several benefits, it isn’t always straightforward. It often adds additional complexity, and monitoring becomes more challenging. More than half of O’Reilly survey respondents cited complexity as their biggest challenge when adopting microservices. A Camunda survey discovered 58 percent of enterprises are running, or planning to run, between 10 and 49 microservices, and 15 percent plan to run more than one hundred. That’s a huge increase over monitoring one traditional server!
Let’s use an e-commerce web server application as an example. In a monolith architecture, if something goes wrong with an application component, the whole application goes down. Though inconvenient, this is often easier to troubleshoot. However, with microservices architecture, this same application is now a combination of tens or hundreds of microservices. There are many more services to monitor — and much more to examine when figuring out what went wrong.
Why Monitor Your Microservices?
One of the more important factors affecting the future success of microservices is observability. Observability tools enable application support teams to track all system calls and service interactions in the case of a failure. This allows teams to locate the root cause of the problem and identify performance issues.
Operations teams must know how a system is performing. Even more so, they need to understand the metrics to identify when a system or application could fail. They need to know which components face repeated errors that reduce reliability and cause the system to be unavailable. Whenever a system or application fails, operations teams must be alerted so they can fix it quickly.
In traditional applications, a call to a backend service typically only executes code within that single service. Think of the webserver scenario we used as an example earlier. The more complex a system is, the more crucial it is to assess it and establish a monitoring baseline based on real-time (or near real-time) metrics.
Monitoring Microservices: What to Measure
Besides using metrics, which are primarily numbers, values, and percentages (think of CPU load, memory load, disk read and write operations, and more), log files are another valuable way to monitor your workloads. Logs often refer to permanent, sometimes immutable, records of events happening in a system or application component. These are typically stored in a text file (for example, syslog on Linux), an event logging system (for example, Windows Event Viewer), or in a larger, centralized, database-like application (for example, Azure Log Analytics, Splunk, or AWS CloudWatch).
It’s also useful to monitor traces. Unlike static metrics and log file information, traces outline a sequence of paths or events that occurred on the application or system. Instead of simply logging event output, traces identify the steps, tasks, or processes leading to the actual event.
Although the monitoring components (metrics, logs, and traces) are irrelevant to the workload environment you need to monitor, they become vital when monitoring a microservice architecture. Instances where a traditional monolith workload uses a centralized system (which allows for a single monitoring endpoint) are completely different in a microservices architecture. Microservices typically need to go through a larger number of other microservices to complete a single request.
The Microservices Monitoring Challenge
Microservices are constantly interfacing and communicating with each other, leading to network and application performance issues. These issues include overall latency and slower responses across all other microservices, which slow the application, creating a poor user experience. Additionally, if a critical component within the microservices architecture fails, it can still cause your entire distributed application workload to stop working.
These challenges make incident management and response even more critical in microservice applications than in more traditional architectures. So, we need a different approach to monitoring microservices. Rather than treating each microservice as a stand-alone component, we need to identify the complexities of cross-microservices interactions.
How to Monitor Microservices Effectively
Although it is not the only solution available today for running a microservices architecture, you are likely already running, or at least considering, Kubernetes. You may have a physical or virtual machine setup (for example, Red Hat OpenShift). Or, you may use Kubernetes through public cloud vendors like Azure Kubernetes Service (AKS), Amazon Elastic Kubernetes Service (EKS), or Google Kubernetes Engine (GKE).
In any architecture, it’s critical to validate that Kubernetes clusters are running and are running healthy. One go-to Kubernetes monitoring solution is Prometheus.
A Prometheus server primarily gathers metrics and values based on a time series concept. This enables Prometheus to provide detailed feedback about the Kubernetes environment, including both real-time and short-term historical data. You can also configure Prometheus to store data longer for compliance and governance regulations. To ensure the diagnostic information is still available during a disaster, a Prometheus server runs as a stand-alone server without dependencies on Kubernetes.
Another component in Prometheus architecture is Grafana. Whereas Prometheus collects the raw data, Grafana is the presentation layer, enabling you to build powerful dashboards and charts to visualize the data.
Although Prometheus is a reference application monitoring solution, administrative teams still need to tune it, especially for monitoring the key components and building blocks that make up your Kubernetes microservices environment. Decide which metrics are valuable to your team. If you’re unsure, start with the kinds of metrics you would monitor in a monolithic application since these still matter in microservice apps. They’re tougher to track in a distributed system, but we’ll introduce some tools to help.
Consider metrics like:
- Is the service running?
- Is CPU and RAM usage within expected ranges?
- Are requests to the service completing quickly enough?
- Is there a noticeable difference in counters or metrics compared to the baseline?
- Are the Kubernetes worker nodes still running?
- How many user and application sessions do we have for the microservice?
- Are we reaching the limits of the Kubernetes environment?
You can also extend metrics monitoring with additional logging and tracing capabilities. Prometheus provides metrics, logs, and tracing, which you’ll recall are beneficial for monitoring microservices architecture.
You can also consider using distributed observability tooling like OpenTelemetry. OpenTelemetry makes it easy to monitor, trace, and log calls across every microservice called to service a request, making it easy to notice and diagnose errors and performance issues.
Incident Management in Microservices
Apart from relying on monitoring and observability, you should also have a dedicated incident management tool with alerting capabilities. As mentioned, microservices introduce additional points of failure. When a single service goes down, it can prevent your entire distributed app from functioning, and it’s tougher to determine the cause of the problem. Similarly, a single slow-performing service can slow the whole application.
The tools we described give you the raw data to recognize and diagnose these problems. However, the data itself doesn’t provide much help if you don’t detect issues immediately. You need to know there is a problem before you can fix it.
A service reliability platform like xMatters helps with incident management. xMatters works closely with your microservice monitoring tools, like Prometheus and an extensive list of other IT tools, and integrates with ticketing systems like Jira and communications platforms like Slack.
The incident management flow looks like this:
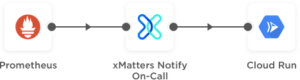
Prometheus’ monitoring layer collects information from the microservices platform. xMatters then recognizes the monitoring information and turns it into an incident stream. This could start with sending an information update to your service management tool, sharing a notification to Slack, Teams, or another collaboration system, or triggering runbooks to help mitigate the root cause of the problem.
The xMatters microservices alerting platform sends contextual notifications to the right people immediately and surfaces the data responders need to resolve the problem quickly.
Conclusion
When paired with automated incident management tools like xMatters, cloud-native microservices-oriented monitoring tools like Prometheus for Kubernetes provide the coverage you need. Ensure microservice applications stay up and perform well. Optimize everything from running the platform to monitoring the platform to efficiently handling incident management.
To combine microservices alerting and monitoring, boosting your incident management toolbox, learn more about xMatters.