How We Adopted Time-Based Monitoring with Prometheus

Categories
DevOps & SRE
Sensu monitoring provides a simple up/down check system. When we switched to Prometheus, we got time-based monitoring and some incredible abilities. Of course, there were also a few pitfalls along the way.
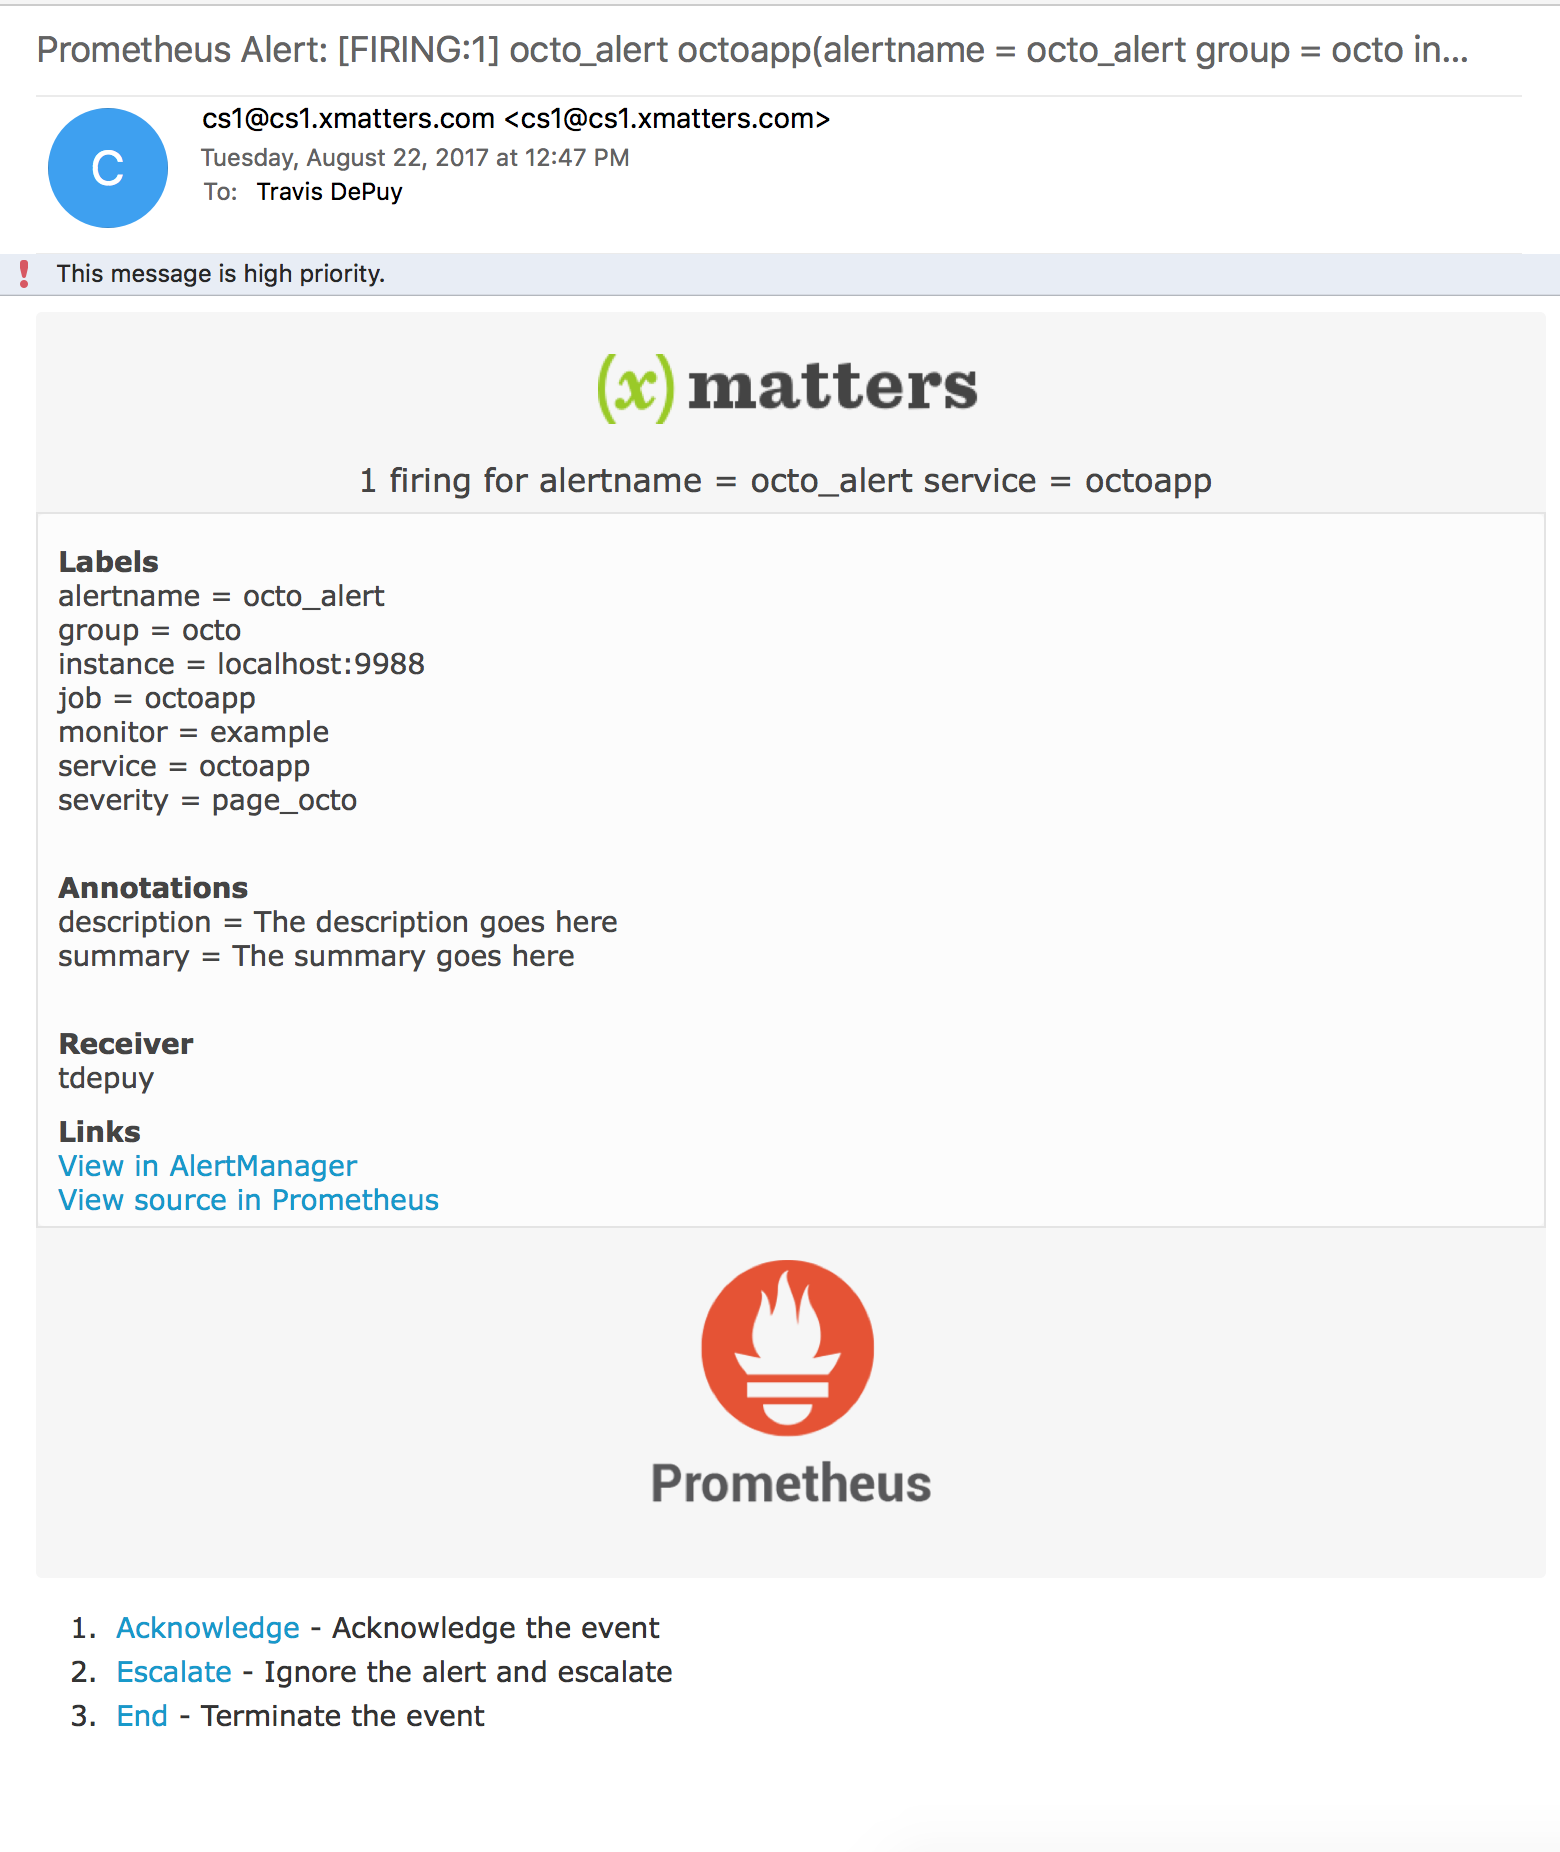
Learn more about the xMLabs xMatters-Prometheus integration on GitHub.
Moving from our own data centers to Google Cloud Platform came with some amazing opportunities to optimize code, speed up deployment processes, downsize infrastructure, and even to evaluate new monitoring system options.
Our original systems were monitored using Sensu, an alerting system with a lot of bells and whistles around automation and extend-ability. But as far as monitoring is concerned, it’s a simple up/down check system. In contrast, Prometheus represented a significant change – from a limited “trinary” signal to your ability to use monitoring data.
Sensu alerting is very simple and you have to write your own checks that return an exit code of 0, 1, or 2 depending on system health.
Prometheus allows you to write your own expressions with the data it has collected so you can check error rates over time, compare deltas, find the 99th percentile of metrics, and any number of things.
To be clear, you can use Prometheus to just replicate Sensu’s simple ‘healthy, error, warning’ style monitoring, but that doesn’t take advantage of its key benefit: time-based monitoring. Time-based monitoring is a very different paradigm from old-skool monitoring, as it gives you some incredible abilities such as alerting only if a condition is met for a specific period of time.
______________________________________________________________________________________________
“Lots of monitoring systems let you delay alerting. Prometheus lets you take a metric like request response speed and perform math on it.”
______________________________________________________________________________________________
I know what you’re thinking. “Curtis, lots of monitoring systems let you delay alerting.” Sure, but that’s not what I’m talking about here. Prometheus offers you the ability to take a metric like request response speed and perform math on it to only alert if, say, less than 99% of your requests are processed in 150ms. It also allows you to do other interesting things like monitoring the rate of increase. For example, if you usually have 10 requests per second, and suddenly the rate of requests skyrockets to 1,000 per second and stays like that for a long period of time.
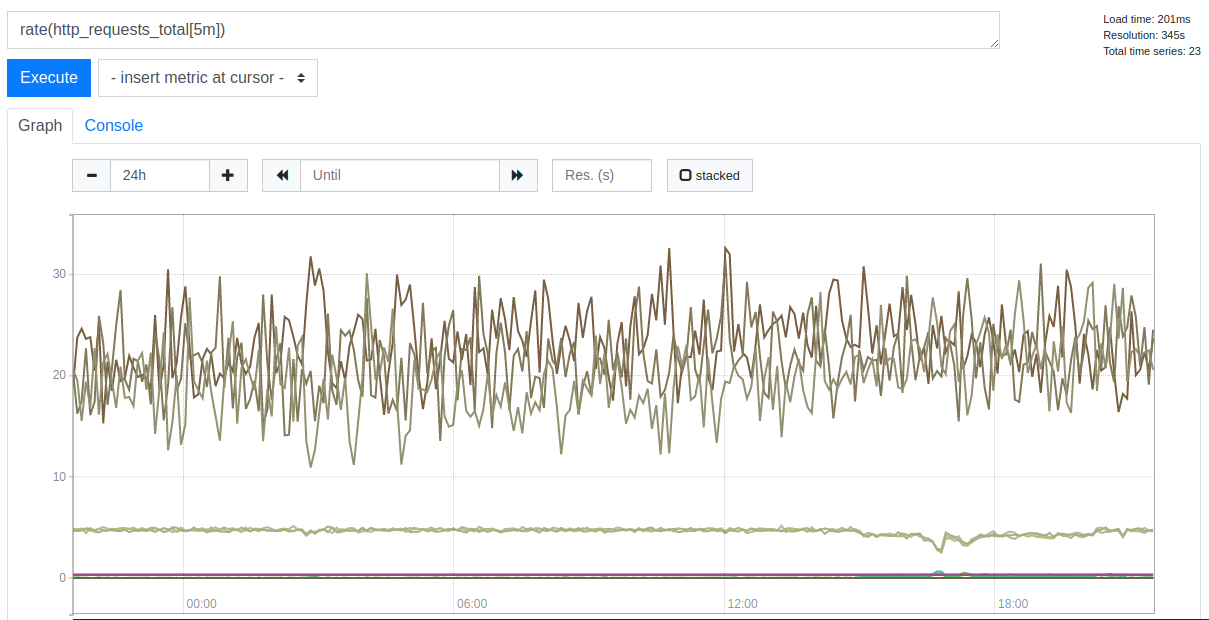
Tracking http requests in Prometheus
Additionally, Prometheus allows you to tag the alert with information you can use to group alerts, services, and machines together. This is incredibly useful when you have high-availability services where you have multiple instances of the same service up; you may not care if one goes down, but you might get a bit ‘lively’ if more than 50% are down. Grouping them can be helpful so you only get paged once for a whole series of alerts, as opposed to getting a page storm (or, as we lovingly call it, “phone melting”).
All that said, let’s go through some of the things you’ll want to pay attention to if you’re using Prometheus for your monitoring solution.
Service discovery
In our shop we use HashiCorp Consul for our service discovery mechanism. One of the great things about Prometheus is that it has an out-of-the-box way to find your services using Consul by setting the consul_sd_config value in the configuration file. This allows you to monitor a service such as Rabbitmq and use Consul tags to further limit your targets. This comes with a huge caveat: if your service disappears from Consul, Prometheus no longer knows about it.
Here’s an example of a problem we’ve run into with this. We run many of our services as three Kubernetes pods, and we want to run a check to ensure 2/3 of the cluster is up:
(avg(up{job="job"}) BY (deployment, version, svcprom_env, branch, clusterid)) < 0.67
If this comes back false, we want to send an xMatters alert to the team responsible for the service that is in an unhealthy state. The problem is if two of your pods disappear from Consul, then only one of your pods is getting scraped for metrics… and Prometheus is quite happy to carry on thinking everything is fine.
Now, you may think that since we’re running three pods, we could just validate that the up check returns >2 instances. However, that stops us from being able to scale our services to, say, seven and expecting five to be up. We got around this by monitoring pod health through Kubernetes endpoints directly instead of relying on pods to tell us their health.
Magic math
We’ve already discussed the power of time-based monitoring, but there is a drawback. You remember all that math you had to learn in school you thought you’d never use because you’re just planning on writing code? Bad news: it’s back! And, this time there’s a compelling reason to bone up on it.
_____________________________________________________________________________________________________________________________
“Remember all that math you had to learn in school you thought you’d never use because you’re just planning on writing code? It’s back!”
__________________________________________________________________________________________________________________
Turns out in order to write meaningful time-based monitoring using services statistics, you need to know, well statistics. But more than that, you need to understand how those statistics relate to writing Prometheus alerting rules. We have some checks that use a histogram to figure out the speed of our notification resolutions. We want 99% of the notifications that go through one of our services to do so in under 125ms.
This means that after you figure out how to bucket your checks properly, you need to figure out how it works in the Prometheus expressions. Here’s an example from the Prometheus documentation:
histogram_quantile(0.95,sum(rate(http_request_duration_seconds_bucket[5m])) by (le))
So, this takes the sum of the rates of HTTP request durations over five minutes and returns the line that the 95th percentile of http_request_duration_seconds falls under.
Make sense? Perfect! You’ll find that summing a rate, delta, or some of the other functions Prometheus provides is very common. It’s the only way to do math while also being able to group by your (hopefully) incredibly useful labels.
Alerting and too many metrics
Let’s see now—what other weird things did we find? Well, here’s one: say you had something alerting, so you solved the problem (or so you thought), and then it falls over again. Would you expect Prometheus to page you again? We did, but that’s apparently not the case. This is because when you have it set to alert only one time per interval, it won’t alert you if it fails again in that interval. I guess that’s not crazy, but we didn’t expect it. You’re welcome.
We use Rabbitmq for multiple systems at xMatters and we thought, “Hey, there’s a Prometheus plugin for Rabbitmq—that’s great!” and we sort of got monkey pawed on that gift. It turned out that Rabbitmq’s exporter has so many metrics that you can crush your service under its own alerting weight.
_____________________________________________________________________________________________________________________________
“Turns out in order to write meaningful time-based monitoring using services statistics, you need to know statistics. But more than that, you need to understand how those statistics relate to writing Prometheus alerting rules.”
__________________________________________________________________________________________________________________
On the upside, Rabbitmq does give you the ability to limit the metrics you generate; the downside is that it’s not incredibly granular, and if you have a lot of queues you’re in for a bad time.
In this situation you also must be prepared for Prometheus svcprom to be more heavily loaded – which means you need to give it more resources – and you need to prepare your pod health checks for a possibly slow startup/render time. If not, expect crash loops to be part of your life (and your nightmares).

Prometheus gave humans fire before he gave us time-based monitoring.
Avoiding Those Hotspots
Of course, you know that Prometheus was a mischievous Titan who stole fire from the gods and gave it to humans. Who wouldn’t want to have a drink with that guy? But you might want to know in advance what you are getting yourself into (and maybe book a separate ride home). Likewise, I hope I’ve given you a sense about some of the joys and pitfalls of implementing the Prometheus monitoring system so that you’re successful and don’t get, uh, burned (sorry, had to be done).
Have you used Prometheus or a different monitoring tool to gain deeper insights into your systems? Let us know on our social channels. To try xMatters for yourself, race to xMatters Free, and you can use it free forever.