Automated Self-Healing: Crash Remediation with xMatters and Dynatrace
Categories
DevOps & SRE
In this blog series, we’ll dive into how DevOps teams can build automated self-healing systems. We’ll show preventative (and not just reactive) action in three different scenarios by leveraging the xMatters digital service availability platform with Dynatrace’s unique AI-powered full stack monitoring.

Roll back a release or apply a hotfix with xMatters and Dynatrace. Click for a bigger image.
In DevOps, incidents aren’t always a lights-out experience. Incidents more often start with one service crashing, then a domino effect that takes other services out with it. These system dependencies occur at every layer of the application stack. With 84% percent of organizations already using a hybrid cloud infrastructure and another 58% planning to move in 2019, the battle between separate but interrelated systems is the new reality of DevOps teams.
According to a recent report, organizations are using up to 124 different SaaS-based apps to keep their business running. While you might be tempted to decouple dependencies to keep one failure from taking out the service of other teams – and seemingly isolating issues so you can more quickly identify the problem – siloing your services and teams is counterproductive to continuous improvement. DevOps teams can take preventative (and not just reactive) action in three different scenarios by leveraging xMatters high performance collaboration platform with Dyntrace’s unique AI-powered full stack monitoring:
- Process crash
- Full disk
- Slow microservices
Scenario #1: Process Crash
Let’s look at how a DevOps team can leverage integrations through xMatters Flow Designer to prevent a process crash from taking down services across the organization.
The workflow in xMatters Flow Designer (below) shows the toolchain we will use to fix a process crash before it impacts other services or customers.
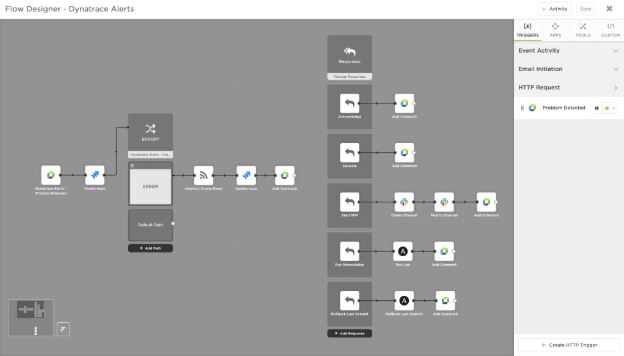
Drag tools into Flow Designer to automate remediation.
What are the key applications to have in your DevOps stack?
Step 1 — Intelligent Application Performance Monitoring: The ability to not only monitor, but intelligently identify root cause of incidents is key. Your application performance monitoring tool is the first line of defense for detecting performance degradation or anomalies that indicate an incident is brewing.
Dynatrace is built to understand how dependencies impact other areas across your infrastructure; should an issue arise, Dynatrace’s AI-driven monitoring automatically relates these to pinpoint root cause and provide context around other impacted services. Once the root cause is identified in Dynatrace, it’s time to get to work fixing the problem.
Dynatrace identifies the root cause so you can fix the problem.
Step 2 — Incident Management: To fix the issue before the next domino falls, you can’t wait on someone to log into their ticketing system or email inbox to see the notification. You need to immediately engage the right people with the issue information from Dynatrace to kick off the resolution process. xMatters, a Digital Service Availability Platform and official Dynatrace partner, uses your on-call schedules, groups, and teams to significantly reduce the time to notify the right responders.
But it’s not enough to just page someone and have them then log into disparate systems to investigate the issue. That’s why xMatters passes the Dynatrace data through alerts, giving you full incident context to inform your remediation path. Depending on the type of Dynatrace issue, xMatters prompts on-call resources with response option buttons that launch workflows across your systems to start the automated self-healing process – and to keep stakeholders and customers updated!

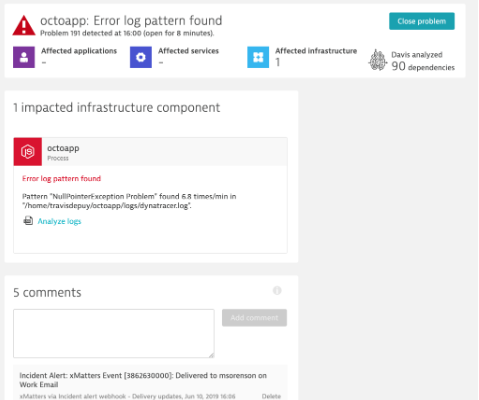
xMatters passes Dynatrace data into alerts (left) with actionable responses (right).
Step 3 — Service Desk: Ticketing systems like Jira Service Desk and Zendesk have become the gold standard for DevOps source of truth. Teams rely heavily on tickets during post mortems so they can identify repeatable processes that can be put in place to help prevent similar incidents in the future. That means tickets should ideally include all incident details, as well as the remediation steps and timeline.
But the reality is that while they’re in the middle trying to resolve an incident, few people take the time to create and update tickets. Instead, they often spend extra time post-resolution to manually transfer incident details from multiple systems, which is both inefficient and prone to error.
That’s why bi-directional integration is paramount. When integrated with xMatters, Jira steps become part of an automated toolchain process, allowing xMatters to create tickets (with full Dynatrace incident data included), assign and update them, and append them with incident resolution information from your other systems (like Slack and Ansible).
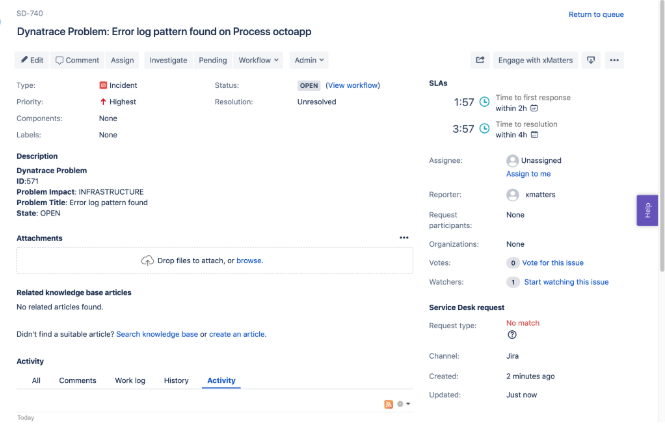
xMatters creates and updates Jira issues with incident information from Dynatrace.
Step 4 — ChatOps: During an incident, DevOps on-call resources typically turn to a chat platform like Slack (rather than comment threads on tickets). The automated workflow launched from xMatters provides a step that spins up a dedicated Slack channel populated with your critical Dynatrace incident data. Slackbot then references your on-call schedule and groups to invite your teammates to join so you can discuss and execute remediation actions in your other tools (like Ansible) without ever leaving Slack. Once the incident is resolved, your Slack channel transcript is automatically attached to the related Jira issue, ready for your post mortem review.

xMatters creates a dedicated Slack channel where users use the Slackbot to find and invite the right team to join.
Step 5 — Configuration Management: When it’s time to push your fix, a configuration management tool such as Ansible allows you to quickly control and execute jobs in your impacted systems. Dynatrace ensures you know what services are affected so you can launch the proper workflow automation from xMatters to Ansible (while simultaneously updating Jira, Dynatrace, and your other integrated systems).
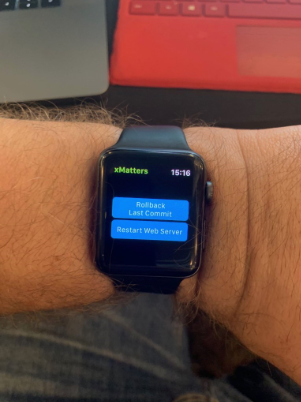
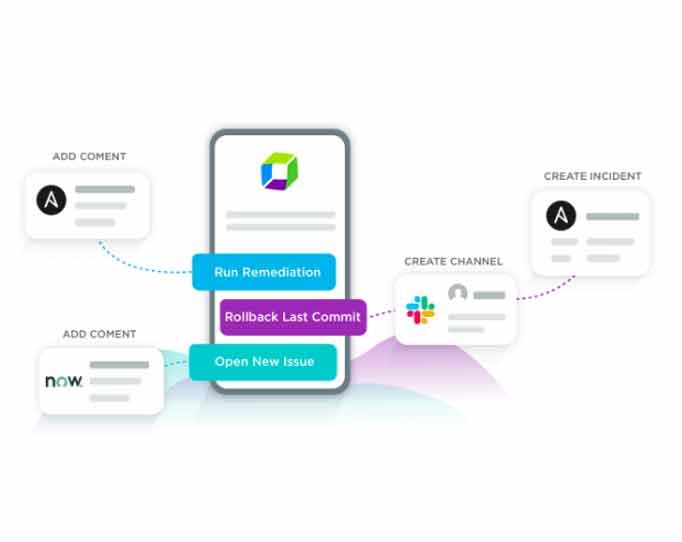
One-click rollbacks – even from your wrist – with the xMatters Mobile App!
Preventing your next process crash
A great customer experience is no longer just about uptime – it’s about performance. Progressive organizations are keenly aware that functional degradation and slow service impacts user experience, so they take preventative measures and more quickly fix issues.
By integrating your systems and putting in place an automated self-healing toolchain to bring a service back up, you drastically reduce incident time and limit impact to customers, other services – and your company’s bottom line.
Coming up next…
Stay tuned for our next blog post, in which we will look at proactively resolving the dreaded full disk.
Ready to get proactive?